
Glossary and appendices
Here we provide definitions of te reo Māori terms, technical terms and abbreviations used throughout the report. You can also find appendices to accompany the main report content.
Contents
- Some key technical terms and how we use them
- Te reo Māori terms
- Technical terms and abbreviations
- Appendices
- Appendix 1: EAFM principles and relevant Fisheries Act 1996 provisions
- Appendix 2: Climate change data
- Appendix 3: Estimates for newly trawled area
- Appendix 4: Land-based effects data
- Appendix 5: New Zealand fisheries legal instruments
- Appendix 6: Key regulators in Aotearoa New Zealand’s marine fisheries space
- Appendix 7: Fisheries Act 1996 schematic
- Appendix 8: Specific marine management acts
- Appendix 9: New Zealand international obligations
- Appendix 10: National fisheries plans management objectives
- Appendix 11: Some history surrounding an oceans strategy in Aotearoa New Zealand
- Appendix 12: Methods and applications of genetic technology in fisheries
- Appendix 13: Genetics in fisheries in Aotearoa New Zealand
- Appendix 14: Further examples of models
- Appendix 15: Ocean acidification studies underway
- Appendix 16: Plan for a New Zealand ocean observing system
- References and footnotes
Some key technical terms and how we use them
A report of this breadth is necessarily cross-disciplinary, incorporating input from a wide variety of people with different expertise, who may use terms in very specific (and sometimes rather different) ways. Here we lay out definitions of some key terms and how we use them in this report. A full glossary of technical terms and abbreviations with definitions can be found below. Approximate translations of all Māori words and phrases are also provided below.
This report is about commercial fishing: taking fish, aquatic life or seaweed in circumstances where a fishing permit is required as per section 89 of the Fisheries Act 1996. We use the term ‘commercial fisheries’ to refer to wild-caught marine life that is harvested to sell. We did not include seaweed in this report.
In this report, sustainability or sustainable use usually refers to sustainability as defined in the Fisheries Act 1996 – that is, (a) maintaining the potential of fisheries resources to meet the reasonably foreseeable needs of future generations, and (b) avoiding, remedying or mitigating any adverse effects of fishing on the aquatic environment. Sometimes, we use a narrower definition referring to the long-term maintenance of a single fish stock without considering the wider ecosystem impacts. At other times, we use a broader meaning of sustainability that encompasses ecological and social factors, including but not limited to biodiversity (genetic, species and ecosystem diversity), environmental and ecosystem impacts.
In this report, a stock or fish stock usually describes a management unit of a species as defined by Fisheries New Zealand (FNZ). A stock may be a discrete biological population, with little to no reproductive mixing with other stocks of the same species. In other cases, there may be migration or mixing between stocks.
Biodiversity refers to the variety of life. It pertains to the variety of different species present, the variability of ecosystems themselves, and diversity within species. Biodiversity is a critical part of ecosystem and planetary health but not the major focus of this report.
An ecosystem approach to fisheries management (EAFM) and ecosystem-based fisheries management (EBFM) are different terms used widely in the literature. Both involve moving beyond single-species measures to incorporate wider ecosystem effects into management. We generally use EAFM, unless referring to specific literature which uses EBFM. They differ from ecosystem-based management (EBM) which refers to management of the ocean more broadly – not just fisheries.
Threatened species are those assessed according to the New Zealand Threat Classification System as facing imminent extinction because of their small total population size and/or rapid rate of population decline. This includes three sub-categories: ‘Nationally Critical’, ‘Nationally Endangered’ and ‘Nationally Vulnerable’. Protected species are defined under the Wildlife Act 1953. In the marine environment, all marine mammals, seabirds (except black-backed gulls), all sea turtles, some corals and some fish are protected species. A species may be protected but not threatened, or it may be both protected and threatened.
People from different disciplines use the term marine protected area (MPA) as an umbrella term for spatial areas in the marine environment where restrictions exist in order to conserve nature or maintain biodiversity values. There are a range of legal tools that offer differing levels of protection in the marine environment. Protected areas in the marine environment include marine reserves (as defined in the Marine Reserves Act 1971), benthic protection areas (BPAs), mātaitai and taiāpure reserves, and others. Different marine protection tools are discussed in detail here. The term MPA is often conflated with ‘marine reserve’ in everyday use, but is uses a wider definition in this report.
Te reo Māori terms
The translations are described based on the Māori Dictionary, and as they are used in this report. Other sources are noted in footnotes.
Technical terms and abbreviations
Since this is a report on commercial fishing, where applicable, we have used the Fisheries New Zealand definition for technical terms and abbreviations in this glossary. We note that there are other definitions of many terms and discuss this for some key terms above.
Appendices
Appendix 1: EAFM principles and relevant Fisheries Act 1996 provisions
Table taken directly from the Fathom report, ‘EAFM and the Fisheries Act 1996’ [9]
Usually we refer to sections of the Fisheries Act 1996 as section X. In this table, these are abbreviated to sX.
| Principles | Key Fisheries Act provisions |
|---|---|
| 1. Ensuring the sustainability of fish stocks | s11 sustainability measures; s13 total allowable catch (TAC); s14 and s14A alternative TACs. |
| 2. Rebuilding depleted stocks | s11 sustainability measures; s13 TAC |
| 3. Ecosystem integrity: safeguarding biodiversity and ecosystem structure and functioning | s8 purpose; s9 environmental principles; s11 sustainability measures. |
| 4. Taking account of species interactions | s9 environmental principles; s13 TAC; s15 fishing-related mortality of marine mammals and other wildlife. |
| 5. Minimising impacts on non-target species | s9 environmental principles; s11 sustainability measures; s15 fishing-related mortality of marine mammals and other wildlife; s72 dumping of fish prohibited. |
| 6. Protecting fisheries habitats | s9 environmental principles; s11 sustainability measures. |
| 7. Managing at appropriate spatial scale | s19 (QMS introduction); s11 sustainability measures; s11A fisheries plans; Part 9 taiāpure-local fisheries and customary fishing. |
| 8. Considering trans-boundary effects | s5 application of international obligations; s17A highly migratory species taken outside NZ fisheries waters; Part 6A high seas fishing; Schedule 1A (fish stocks agreement). |
| 9. Managing at appropriate temporal scale | s8 purpose; s9 environmental principles; s13 TAC; s11 sustainability measures; s11A fisheries plans. |
| 10. Adopting a precautionary approach | s5 application of international obligations; s8 purpose; s9 environmental principles; s10 information principles; s13 TAC. |
| 11. Using science and diverse forms of knowledge | s12 consultation; Part 10 record keeping and reporting; Part 12 observer programme. |
| 12. Broadening stakeholder participation | s12 consultation; various specific consultation provisions; s11A fisheries plans; various provisions enabling active stakeholder involvement; s5 application of Treaty of Waitangi (Fisheries Claims) Settlement Act 1992. |
| 13. Recognising and providing for Indigenous rights | s5 application of Treaty of Waitangi (Fisheries Claims) Settlement Act 1992; s12 consultation; s44 (settlement allocation); Part 9 taiāpure-local fisheries and customary fishing. |
| 14. Balancing utilisation and sustainability | s8 purpose. |
| 15. Taking account of social and economic factors | s8 purpose; s13 TAC; s14A alternative TAC; Part 9 taiāpure-local fisheries and customary fishing; s123 dispute resolution; Part 14 cost recovery. |
| 16. Taking account of environmental influences on fisheries | s11 sustainability measures; s13 TAC; s16 emergency measures. |
| 17. Encouraging integrated management | s6 application of RMA; s11 sustainability measures; s15 fishing-related mortality of marine mammals and other wildlife. |
Appendix 2: Climate change data
The table below highlights environmental areas of concern and summarises the Ministry for the Environment’s marine environmental reporting in these areas (taken from Our Marine Environment 2019). This is not a comprehensive summary of all environmental information available – it is to show what information is analysed and presented within the current environmental reporting framework.
Climate and oceans
| Indicator | Measurement | 2018/2019 summary |
|---|---|---|
| Sea-level rise | National mean trends in annual sea-level rise at four long-term monitoring sites (Auckland, Wellington, Lyttelton and Dunedin). | The rate of sea-level rise has increased (the average rate in the past 60 years was more than double the rate of the previous 60 years). |
| Ocean sea-surface temperature | Average temperature recorded by satellite since 1981. | The seas are warming – satellite data recorded an average increase of 0.2°C per decade since 1981. |
| Extreme wave events | Extreme wave events from 2008. | Frequency of extreme wave events is increasing to the east and south of New Zealand and decreasing on the North Island’s west coast and to the north of the Bay of Plenty. The short time period makes it too early to definitively separate this trend from longer-term climate cycles. |
| Ocean acidity | pH of New Zealand subantarctic surface waters along from the Munida Transect, from 1998. New dataset for coastal water pH for nine sites across NZ. | Long-term measurements of subantarctic waters off the Otago coast show an increase of 7.1% in ocean acidity in the past 20 years. More data is needed before role of climate change can be separated from other factors that may be affecting coastal water acidity. |
| Primary productivity | Abundance of phytoplankton (measured as chlorophyll-a) measured by satellite near the sea surface from 1997. | The abundance of phytoplankton has increased and decreased in different New Zealand waters. Changing oceanic productivity is specific to the location; an increase or decrease in one area may not have the same impacts as in another area. |
| Marine heatwaves | High sea-surface temperatures over significant area and for significant duration. | Marine heatwaves are increasing in frequency. A marine heatwave occurring in the Tasman Sea and south of the Chatham Rise in 2017/18 was unprecedented (based on data since 1981). |
Appendix 3: Estimates for newly trawled area
Tables reproduced from [10].
For the deepwater fish stocks, the number of cells contacted in a year, that had not been contacted in previous years, and the aggregate area and footprint within those cells. A base of 25,103 cells were contacted in 1990-94, and, for example, 1,316 cells were contacted in 1995 (but not in 1990-94), with an aggregate area of 1,201 km² and footprint of 1,022 km². The table shows the equivalent data for Tier 1 and Tier 2 fish stocks.
| Fishing year | No. new cells | Aggregate area (km²) | Footprint (km²) |
|---|---|---|---|
| No. cells contacted in 1990-4 = 25,103 | |||
| 1995 | 1,316 | 1,201.5 | 1,022.3 |
| 1996 | 1,420 | 1,032.1 | 948.8 |
| 1997 | 1,185 | 916.0 | 868.5 |
| 1998 | 1,543 | 1,892.8 | 1,538.1 |
| 1999 | 1,388 | 1,360.6 | 1,172.7 |
| 2000 | 1,227 | 1,517.1 | 1,363.2 |
| 2001 | 737 | 715.7 | 614.1 |
| 2002 | 1,173 | 1,050.2 | 1,007.5 |
| 2003 | 633 | 703.5 | 629.7 |
| 2004 | 328 | 319.8 | 294.9 |
| 2005 | 557 | 587.0 | 519.9 |
| 2006 | 266 | 134.0 | 129.3 |
| 2007 | 251 | 153.4 | 143.7 |
| 2008 | 279 | 191.0 | 177.7 |
| 2009 | 220 | 99.7 | 96.6 |
| 2010 | 165 | 60.3 | 59.5 |
| 2011 | 167 | 59.1 | 58.7 |
| 2012 | 106 | 36.9 | 36.7 |
| 2013 | 74 | 35.6 | 35.0 |
| 2014 | 94 | 34.4 | 34.2 |
| 2015 | 178 | 171.8 | 157.7 |
| 2016 | 172 | 108.6 | 104.5 |
| 2017 | 100 | 60.8 | 59.4 |
| 2018 | 117 | 32.8 | 32.8 |
| 2019 | 73 | 89.9 | 85.7 |
For the inshore fish stocks, the number of cells contacted in a year, that had not been contacted in previous years, and the aggregate area and footprint within those cells. A base of 9,459 cells were contacted in 2008 (the fishing year that tow-level data were first collected for all inshore fisheries), and, for example, 1,497 cells were contacted in 2009 (but not in 2008), with an aggregate area of 819.3 km² and footprint of 775.9 km².
| Fishing year | No. new cells | Aggregate area (km²) | Footprint (km²) |
|---|---|---|---|
| No. cells contacted in 2008 = 9,459 | |||
| 2009 | 1,497 | 819.3 | 775.9 |
| 2010 | 934 | 657.8 | 576.4 |
| 2011 | 771 | 304.1 | 296.9 |
| 2012 | 484 | 151.7 | 148.3 |
| 2013 | 384 | 145.4 | 142.4 |
| 2014 | 400 | 167.9 | 161.0 |
| 2015 | 316 | 133.0 | 130.2 |
| 2016 | 285 | 79.1 | 79.1 |
| 2017 | 275 | 80.6 | 80.5 |
| 2018 | 198 | 66.1 | 65.9 |
| 2019 | 196 | 63.5 | 62.3 |
Appendix 4: Land-based effects data
Fisheries New Zealand, as reported in the trends and indicators section of the Aquatic Environment and Biodiversity Annual Review:
| Indicator | Measurement | 2018/2019 summary |
|---|---|---|
| Land-based effects on the coastal environment | ||
| A national view of the impacts of land‐based influences upon seafood production does not exist. | N/A | N/A |
The table below highlights environmental areas of concern and summarises the Ministry for the Environment’s marine environmental reporting in these areas. This is not a comprehensive summary of all environmental information available – it is to show what information is analysed and presented within the current environmental reporting framework.
Human land use and sediment impacts
| Indicator | Measurement | 2018/2019 summary |
|---|---|---|
| Sediment | Focus on sediment accumulation in estuaries. | Accumulation rates have increased. Intertidal sedimentation rates have generally increased and become highly variable since European settlement. |
| Biogenic habitats | Review of the state of key biogenic habitats using nationally available data. | Most have decreased (e.g. mussel beds, seagrass meadows). |
| Litter and contaminants | Beach litter density, monitoring of contaminants limited and inconsistent. | Have increased in the habitat and food webs, particularly plastic. |
| Water quality | Nutrients (phosphorus and nitrogen), phytoplankton, oxygen, water clarity, and pH monitoring. | It is difficult to assess the overall state of coastal water quality. |
Appendix 5: New Zealand fisheries legal instruments
New Zealand fisheries legal instruments: Acts and regulations
Appendix 6: Key regulators in Aotearoa New Zealand’s marine fisheries space
Fisheries New Zealand (Ministry for Primary Industries)
Fisheries New Zealand is the key regulator tasked with guiding the sustainable use of fisheries resources to the greatest overall benefit to New Zealanders.
This focus includes the sustainability of New Zealand’s wild fish stocks, aquaculture, and the wider aquatic environment.
Key legislation Fisheries New Zealand administers includes:
- Fisheries Act 1996 and regulations
- Fisheries Act 1983 (residual parts)
- Treaty of Waitangi (Fisheries Claims) Settlement Act 1992
- Fisheries (Quota Operations Validation) Act 1997
- Māori Fisheries Act 2004
- Māori Commercial Aquaculture Claims Settlement Act 2004
- Aquaculture Reform (Repeals and Transitional Provisions) Act 2004
- Driftnet Prohibition Act 1991
- Antarctic Marine Living Resources Act 1981
Department of Conservation
The Department of Conservation is the key regulator for species protection and biodiversity in the marine space.
This includes marine reserves and parks, protection of protected or threatened species, and protection of biodiversity.
Key legislation the Department of Conservation administers includes:
Ministry for the Environment
The Ministry for the Environment is responsible for national environmental reporting, including the marine environment, and promoting the sustainable management of natural resources in our EEZ and continental shelf.
Key legislation the Ministry for the Environment administers includes:
Regional councils
Our 11 regional councils are responsible for managing the territorial sea (out to 12 nautical miles).
This includes land use and its impacts on the marine environment.
Regional councils are empowered in the marine space through the:
Other regulators
Ministry of Foreign Affairs and Trade represents Aotearoa New Zealand in global discussions to ensure successful implementation of international agreements on ocean governance and fisheries management.
Ministry of Business, Innovation and Employment is responsible for health and safety in the marine environment. This includes managing permits and licences for oil, gas and minerals (via New Zealand Petroleum and Minerals).
Environmental Protection Authority is responsible for consenting, monitoring and enforcement under the EEZ Act.
Ministry of Transport is responsible for the Maritime Transport Act 1994.
Maritime New Zealand is responsible for managing maritime transport and its effects.
National Maritime Coordination Centre is responsible for managing Aotearoa New Zealand’s maritime surveillance. It is part of the New Zealand Customs Service.
Many other ministries have adjacent or supporting roles: Te Arawhiti, Department of Prime Minister and Cabinet, Te Puni Kōkiri, Ministry for Culture and Heritage, New Zealand Defence Force, Ministry of Health, Ministry of Justice, Stats NZ, and Land Information New Zealand.
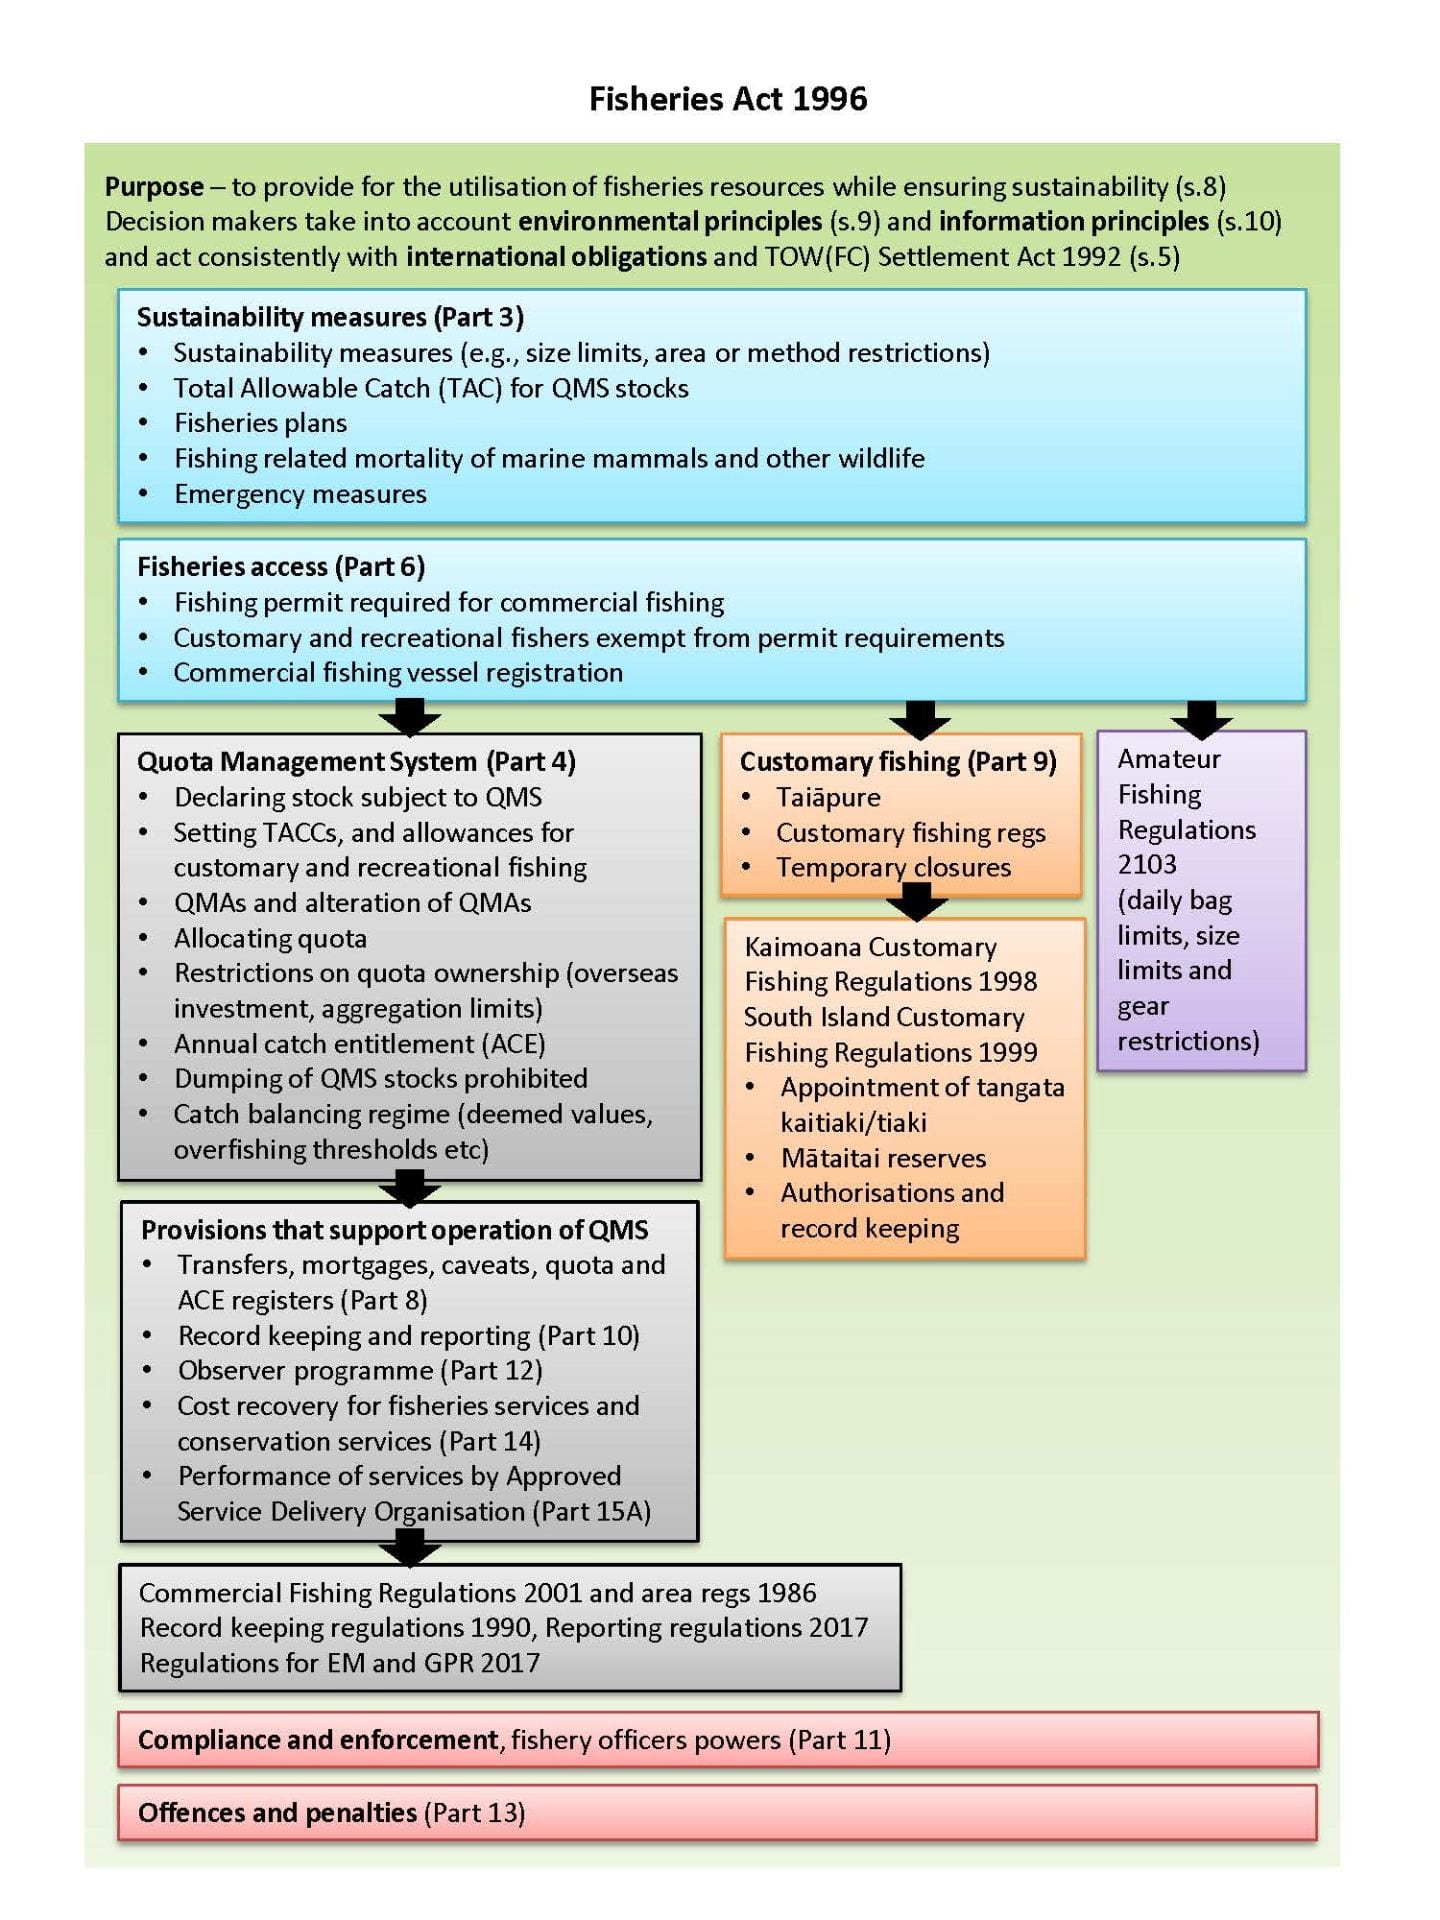
Appendix 7: Fisheries Act 1996 schematic
As provided by industry:
Appendix 8: Specific marine management acts
Hauraki Gulf Marine Park Act 2000
- Integrates management of the natural, historic, and physical resources of the Hauraki Gulf, its islands, and catchments.
- Establishes the Hauraki Gulf Marine Park.
- Establishes objectives for the management of the Hauraki Gulf, its islands, and catchments.
- Recognises the historic, traditional, cultural, and spiritual relationship of the tangata whenua with the Hauraki Gulf and its islands.
- Establishes the Hauraki Gulf Forum.
Admin: Department of Conservation.
Fiordland (Te Moana o Atawhenua) Marine Management Act 2005
- Establishes the Fiordland (Te Moana o Atawhenua) Marine Area and eight marine reserves in that area.
- Implements measures to assist in the preservation, protection, and sustainable management of the marine environment and biological diversity of the Fiordland (Te Moana o Atawhenua) Marine Area.
- Establishes the Fiordland Marine Guardians to provide advice on fisheries management, biosecurity, sustainable management, and marine preservation and protection.
- Facilitates and promotes co-operation between the Guardians and management agencies, to assist in achieving the integrated management of the Fiordland (Te Moana o Atawhenua) Marine Area.
- Acknowledges the importance of kaitiakitanga.
Admin: Ministry for the Environment.
Kaikōura (Te Tai ō Marokura) Marine Management Act 2014
- Recognises the local, national, and international importance of the coast and sea around Kaikōura (Te Tai ō Marokura) as a consequence of its unique coastal and marine environment and distinctive biological diversity and cultural heritage.
- Provides measures to assist the preservation, protection, and sustainable and integrated management of the coastal and marine environment and biological diversity of Te Tai ō Marokura.
- Acknowledges the importance of kaitiakitanga and local leadership.
- Establishes an advisory committee to provide advice regarding biosecurity, conservation, and fisheries matters within a marine management area.
- Establishes, within Te Tai ō Marokura:
- a marine reserve,
- a whale sanctuary,
- a New Zealand fur seal sanctuary, and
- various mātaitai reserves and taiāpure-local fisheries.
- Amends the Fisheries (Amateur Fishing) Regulations 2013 to provide specific regulation of amateur fishing in the marine management area.
Sugar Loaf Islands Marine Protected Area Act 1991
Ensures that the scenery, natural features, and ecosystems of the Protected Area that should be protected and conserved by reason of their distinctive quality, beauty, typicality, or uniqueness are conserved.
Admin: Department of Conservation.
Subantarctic Islands Marine Reserves Act 2014
Provides for the setting up and management of the Subantarctic Islands Marine Reserves, so as to conserve and protect its scenery, natural features and ecosystem.
Admin: Department of Conservation.
Appendix 9: New Zealand international obligations
Appendix 10: National fisheries plans management objectives
Management objectives of the National Fisheries Plan for Deepwater and Middle-depth Fisheries.[11]
| Management objectives | ||
|---|---|---|
| Use | 1 | Ensure the deepwater and middle-depth fisheries resources are managed so as to provide for the needs of future generations. |
| 2 | Ensure excellence in the management of New Zealand’s deepwater and middle-depth fisheries, so they are consistent with, or exceed, international best practice. | |
| 3 | Ensure effective management of deepwater and middle-depth fisheries is achieved through the availability of appropriate, accurate and robust information. | |
| 4 | Ensure deepwater and middle-depth fish stocks and key bycatch fish stocks are managed to an agreed harvest strategy or reference points. | |
| Environmental outcome | 5 | Ensure that maintenance of biological diversity of the aquatic environment and protection of habitats of particular significance for fisheries management are explicitly considered in management. |
| 6 | Manage deepwater and middle-depth fisheries to avoid, remedy or mitigate the adverse effects of these fisheries on associated or dependent and incidentally caught fish species. | |
| 7 | Manage deepwater and middle-depth fisheries to avoid, remedy or mitigate the adverse effects of these fisheries on the benthic habitat. | |
| 8 | Manage deepwater and middle-depth fisheries to avoid, remedy or mitigate the adverse effects of these fisheries on the long-term viability of endangered, threatened and protected species populations. | |
| Governance conditions | 9 | Ensure the management of New Zealand’s deepwater and middle-depth fisheries meets the Crown’s obligations to Māori. |
| 10 | Ensure there is consistency and certainty of management measures and processes in the deepwater and middle-depth fisheries. | |
| 11 | Ensure New Zealand’s deepwater and middle-depth fisheries are transparently managed. | |
Management objectives of the National Fisheries Plan for Highly Migratory Species (HMS).[12]
| Management objectives | ||
|---|---|---|
| Use | 1 | Support viable and profitable commercial tuna fisheries in New Zealand |
| 1.1 | Support initiatives to add value to HMS fisheries. | |
| 1.2 | Negotiate favourable country allocations for New Zealand fishers. | |
| 1.3 | Reduce administrative barriers to profitability in HMS fisheries. | |
| 1.4 | Recognise importance of access to fisheries resources in New Zealand and the South Pacific region, and identify potential threats and opportunities. | |
| 2 | Maintain and enhance world class game fisheries in New Zealand fisheries waters. | |
| 2.1 | Maintain and enhance recreational catch rates for HMS game fisheries. | |
| 3 | Māori interests (including customary, commercial, recreational, and environmental) are enhanced. | |
| 3.1 | Take into account the views of relevant iwi and hapū in management of HMS. | |
| 3.2 | Ensure abundant HMS for customary use. | |
| Environmental | 4 | Maintain sustainable HMS fisheries within environmental standards. |
| 4.1 | Encourage management of HMS at specified target reference points. | |
| 4.2 | Support the objectives of the National Plan of Action for Sharks. | |
| 4.3 | Promote sustainable management of HMS fisheries through RFMOs. | |
| 5 | Implement an ecosystem approach to fisheries management, taking into account associated and dependent species. | |
| 5.1 | Recognise value of HMS and their ecosystems, including predators, prey, and protected species. | |
| 5.2 | Improve the quality of information available on the capture of protected species. | |
| 5.3 | Avoid, remedy, or mitigate the adverse effects of fishing on associated and dependent species (including protected species), using a risk assessment approach. | |
| 5.4 | Support the objectives of the National Plan of Action for Seabirds. | |
| 6 | Protect, maintain, and enhance fisheries habitat. | |
| 6.1 | Identify and, where appropriate, protect habitats of particular significance to HMS, especially within New Zealand fisheries waters. | |
| Governance | 7 | Maintain an effective fisheries management regime. |
| 7.1 | Ensure transparency by providing stakeholders with relevant information and performance indicators for HMS fisheries. | |
| 8 | Recognise and provide for Deed of Settlement obligations. | |
| 8.1 | Implement Deed of Settlement obligations as they relate to HMS. | |
| 9 | Ensure New Zealand interests are taken into account internationally. | |
| 9.1 | Influence international fora and ensure New Zealand interests are taken into account. | |
| 9.2 | Build and maintain strong relationships with other fishing nations, in order to influence international fora governance. |
|
| 10 | Contribute to Pacific capacity development. | |
| 10.1 | Contribute to the implementation of MPI’s Memorandum of Understanding with NZAID on Pacific capacity development. | |
Appendix 11: Some history surrounding an Oceans Strategy in Aotearoa New Zealand
The idea of an Oceans Strategy has been around for a long time. In 1998, Australia explored its own Ocean Policy to set ‘in place the framework for integrated and ecosystem-based planning and management for all of Australia’s marine jurisdictions’.
Shortly after, in 2000, the New Zealand Government announced plans for development of their own Oceans Policy. Then Fisheries Minister, Pete Hodgson, stated in the announcement:
“We begin simply with a recognition of the value of our oceans, a recognition of the growing pressures on the marine environment, and a determination to address problems before they become crises…. Vast or not, ecological strains have begun to show in our oceans. Conflicts in their use are erupting more and more frequently… If there is one simple reason why an Oceans Policy is a good idea, it is that those strains and conflicts will increase. That’s a certainty…
But do we have overarching goals well defined? What are the points of reference for this complex mixture of law and practice? Have we ever collectively identified and expressed the range of cultural, economic, environmental or social values that apply? Or the range of interests?
Have we ever looked forward 20 years, and identified the opportunities and threats we might encounter?”
The vision created to support the Oceans Policy was:
Healthy Oceans: wisely managed for the greatest benefit of all New Zealanders, now and in the future.[13]
The Oceans Policy was never completed. Some of the delays were reportedly so that it could take account of government decisions on public access and customary rights to the foreshore and seabed.
Another strategy of mention is the Strategy for Managing the Environmental Effects of Fishing (known as SMEEF) developed by the then Ministry of Fisheries in 2005, which proposed the development of a set of standards for defining acceptable limits of effects of fishing on the aquatic environment. Challenges to setting limits identified included:[14]
- “The scale of impact that fishing is having on aspects of the aquatic environment
- The biological consequences of that impact
- The utilisation value associated with that impact, or the cost of avoiding it
- The value placed on that impact by society
- The value likely to be placed on that impact by future generations”
In practice, much of the work on developing standards has been superseded by the development of National Plans of Action.
Over the subsequent years there have been various calls for greater development of maritime strategy.[15, 16] In 2014, NIWA’s Marine Futures project funded by MBIE sought to enable stakeholders to develop an agreed decision making framework to facilitate ‘economic growth, improve marine stewardship and ensure that cumulative stresses placed on the environment do not degrade the ecosystem beyond its ecological adaptive capacity’. It was hoped the research would help decision making where there were conflicting resource uses and different trade-offs, allowing improved integrative management activities (like marine spatial planning and ecosystem-based management).
In 2014, the McGuiness Institute Te Hononga Waka (a ‘non-partisan think tank’) held a structured discussion on ocean management as part of their OneOceanNZ project. The project looks at how public policy solution around ocean governance can support best practice ocean management. In the discussion they found that the ineffective aspect of the existing framework most commonly cited was a fragmented political and policy process, followed by fragmented legislation, lack of scientific information, lack of a clear national goal, and imbalance of economic/social/environmental objectives.[17] Nationally holistic strategic considerations are not able to be made in a consistent and considered way.[18]
Appendix 12: Methods and applications of genetic technology in fisheries
There are a range of methods for generating genetic data and numerous ways to apply these methods to glean information that can inform fisheries management decisions. Looking to the future in fisheries management, we are better to focus on the application of genomic approaches rather than traditional genetic methods, though there will still be applications where older methods are appropriate. The table below highlights key methods that are available for genomic studies.
Whole genome sequencing (WGS)
What it is
Sequencing all of the DNA found in the nucleus of the cell.
Strengths
- Captures majority of genetic variation in a population and is typically summarised as SNP differences.
- Can delineate differences based on fine-scale similarities and differences.
- High throughput, so can sequence many samples at once.
- Can detect both genome-wide (neutral) and allele-specific (adaptive) patterns of diversity.
Limitations
- Price.
- Production of large volumes of genome sequence data can be challenging for the transfer, storage and analysis of datasets.
- Data capture improved by the presence of a reference genome.
Best suited applications/uses
- Delineating stock structure.
- Developing reference SNP marker sets that can be used for a SNP chip to delineate stocks/species/provenance/sexes.
- Understanding of population structure and the evolutionary process.
- Identifying species for conservation efforts, detecting pathogens, compliance surveillance etc.
- Identifying individuals for conservation efforts (e.g. through genetic tagging).
- Stock size (note: best for species with small population sizes).
- Understanding age demographics of population (with epigenomics) or for biopsied samples through telomere length (though this is not validated for most species).
- Can be combined with eDNA and ancient DNA applications.
- Traceability.
Gene-tagging
What it is
Sequencing the genes from a biopsied sample and using their unique genetic fingerprint as a tag to track that individual in the future.
Strengths
- Allows estimating real-time migration rates and dispersal.
- Could replace physical tagging as it is permanent and cannot get lost.
- Data can be used for other applications.
- Can identify the species or the population of origin of exploited fish, as well as their associated pathogens.
- Doesn’t rely on self-reporting from fishers.
Limitations
- Invasive technique.
- May not be better than conventional approaches if samples are from dead specimens or sampling is lethal.
Best suited applications/uses
- See case study: Genetic tagging to understand bluefin tuna population dynamics.
- Can provide information about stock biomass and growth and how these change through time.
- Best used for species where the biopsy is low-risk.
- Use WGS to have the power to identify unique individuals.
Mitochondrial DNA (mtDNA) sequencing
What it is
Sequencing the short, circular DNA found in the mitochondria of the cell.
Strengths
- Cheaper than WGS techniques.
- Methods well established.
- More species have had their mtDNA sequenced so there are more reference genomes.
Limitations
- Limited statistical power to identify unique individuals.
- Often fails to detect population differences.
- Limited value as a gene-tagging marker.
Best suited applications/uses
- eDNA applications because it can be used to identify species and many have reference barcodes for it.
- Ancient DNA applications because it is abundant in the cell so remains after degradation.
- Identifying species.
- Detect mixed species stocks.
- Useful for preliminary stock structure analyses.
Sequencing genetic markers
What it is
Sequencing a select number of genetic markers, typically SNPs.
Strengths
- Cheaper than WGS techniques.
- Method well established.
Limitations
- Have to know what genetic markers can provide the information you are after (e.g. delineate stocks) to design the test.
- Cannot be used to identify unique individuals if a limited number of markers are used.
Best suited applications/uses
Detect mixed species stocks. See case study: Real-time genetic management of a marine fishery.
Microsatellite DNA
What it is
Detecting variation in length of specific repetitive stretches of DNA.
Strengths
Cheaper than WGS techniques.
Limitations
- Limited statistical power to identify unique individuals.
- Often fails to detect population differences.
Best suited applications/uses
- Species identification.
- Understanding genetic variation and stock structure.
RNA sequencing
What it is
Measuring gene expression.
Strengths
Tells us about responsiveness to environmental conditions if baseline data is available.
Limitations
- Requires specific sample collection and storage to ensure results are valid because the RNA degrades.
- Cost – as it is usually more expensive than DNA-based methods per individual.
Best suited applications/uses
Support conservation management of species by understanding responses to environmental change.[19]
DNA methylation
What it is
Detecting variation in epigenetic patterns which can impact gene expression.
Strengths
- Tells us about responsiveness to environmental conditions.
- Can provide information about sample age.
- More stable to measure than RNA.
Limitations
- Need to understand the association between DNA methylation signatures and the outcome for this to be applicable – limited data on age-related epigenetic signatures for fish so requires study first but proof-of-principle exists.[20]
- Requires baseline data.
Best suited applications/uses
- Understanding age demographics of population or for biopsied samples.
- Support conservation management of species by understanding responses to environmental change.
Environmental DNA (eDNA)
What it is
Collecting DNA from the environment (e.g. collection of seawater) and sequencing it to identify the different species that have been in that area recently.
Strengths
- Non-invasive sampling.
- Can provide a high-level overview of genetic biodiversity, including presence/absence data.
- Can detect ecosystem changes over time.
- Can identify elusive species or detect low-density or pelagic species.
- Can be used to estimate species abundance (not yet precise numbers of fish but this may improve in the future with analytical advances).[21–23]
- Overcomes limitations in more complex biological survey methods e.g. time-consuming microscopy, difficulties identifying different life stages and sexes, and cryptic species.
Limitations
- Methods are relatively new and still require sampling and analytical consistency to make sure results are robust (e.g. weather conditions or recent trawling could impact findings).[24]
- Relies on species having reference DNA in databases to match the sample. These databases will continue to grow making this application more powerful.
- Quick degradation of DNA in marine environment.[21]
- Potential for contamination from fishing gear or lab contamination.[23]
- No direct information on numbers, age, weight, life-stage or fecundity.[23]
Best suited applications/uses
- Use in conservation and biosecurity by detecting specific species. See case study: Managing great white shark conservation through environmental DNA.
- Monitoring ecosystems through species detection, determining species diversity and further details about ecosystem function e.g. diet, pathogens, invasive species.[24, 25]
- Potential to provide abundance data and input into management decisions.
- Potential to collect samples now for future use with technological advances. Need to ensure these are collected correctly so that DNA does not degrade.[23]
Ancient DNA
What it is
Extracting and sequencing DNA from ancient samples (e.g. over 100 years old).
Strengths
Provides genetic information from a snapshot in history which can be compared to modern samples.
Limitations
Degradation of DNA over time means DNA may not be able to be retrieved from all samples, but technological advances are reducing this issue.[26]
Best suited applications/uses
Answering evolutionary ecology questions which can inform management and conservation decisions. See case study: What does ancient DNA tell us about the snapper population?
Appendix 13: Genetics in fisheries in Aotearoa New Zealand
The local genetics work in the fisheries sector includes:
- A recently funded SIL project led by the Deepwater Group and Plant & Food Research investigates the stock structure of hoki in Aotearoa New Zealand waters. The study employs WGS of individuals from 10 locations and will assemble the genome of hoki (contact person Dr Maren Wellenreuther).
- Dr Maren Wellenreuther and Dr Peter Ritchie together oversee projects on ancient DNA in snapper to study fisheries-induced evolution (Marsden-funded) and tarakihi stock structure (MBIE-supported). Both projects apply WGS methods, and use genome assemblies.
- Dr Maren Wellenreuther leads a project investigating the role of epigenomic versus genomic variation in enabling rapid adaptation to a changing climate (Marsden-funded). The data will be produced using whole genome and epigenome sequencing and use the snapper genome.
- Together with researchers in Australia (led by Professor Beheregaray), Dr Maren Wellenreuther investigates the stock structure of snapper in Australia and Aotearoa New Zealand using genome-wide markers (ARC Linkage Program-funded) using reduced representation libraries and some WGS and the snapper genome.
- The Ira Moana – Genes of the Sea project is enabling a collaborative network of scientists to deliver a searchable meta-database for genetic and genomic data (from both old and next-generation sequencing techniques) for terrestrial and marine species, as well as environmental samples.
- A study at the Cawthron Institute taking seabed samples from beneath fish farms to detect bacterial DNA to check whether these farms are meeting best practice management practice. This could be an alternative or complementary method and is considered to be cost-effective (contact person is Xavier Ponchon).
- A group led by Dr Peter Ritchie at the Victoria University of Wellington researches the population genetics of the New Zealand scampi.
- Genomics Aotearoa have provided funding in this area to allow the development of new shallow sequencing methods in marine fisheries species (contact Dr Maren Wellenreuther) and to trial improved sequencing and assembly methods for key species, and this is being trialled on the blue cod genome.
- A special issue focused on eDNA is coming out in 2021 New Zealand Journal of Zoology.
- A review on the use of genetics on Aotearoa New Zealand fisheries was published in late 2020.[27]
Appendix 14: Further examples of models
A non-exhaustive list of additional models for application in the marine domain.
BayesNet model
 How was is developed?
Expert workshop and elicitation process.
How can we use it?
It can be used to demonstrate how different management decisions lead to varying outcomes, the importance of which will vary among stakeholders. It can be used to gain consensus around management decisions.
Further development required?
The existing model and user interface requires revisiting through a proper stakeholder- and iwi-run process, whereby they are participants in the model’s construction and use.
Plastic tracker
![]() How was is developed?
How was is developed?
Coding for efficient post-processing of data generated by hydrodynamic models.
How can we use it?
To visualize connectivity of our coastal waters. The tool is easily accessed and used with any device capable of logging onto the internet through browser (other than Internet Explorer).
Further development required?
No further development required, however, the tool can be expanded to the whole of the EEZ.
Contamination nowcasting tool
 How was is developed?
Integration of catchment, river flow, coastal hydrodynamic, and bacterial survivorship models, with using real data for validation and tuning.
How can we use it?
To obtain ‘nowcasts’ of the spatial extent of river plumes and levels of faecal indicator bacteria. Aquaculture farmers and council staff can use the tool to assist in managing shellfish harvest and beach closures. It can also serve as a wider communication tool for highlighting land-sea connectivity.
Further development required?
Full validation process and trials are required prior to roll out.
System mapping
 How was is developed?
Series of workshops and interviews with experts, stakeholders and iwi.
How can we use it?
Facilitating decision making; for example in helping communities to prioritise, rationalise and implement management interventions that will assist in restoring seabed health and fisheries.
Further development required?
Two systems maps have been completed (one pilot and one Māori-led). A full systems mapping exercise would be warranted to use to inform decisions.
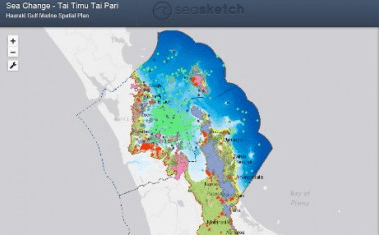
SeaSketch
 How was is developed?
Developed at UC Santa Barbara, and parameterised/ populated by Sustainable Seas and DOC scientists.
How can we use it?
The mapping tool can be used to share spatial information and data layers widely with non-GIS experts, and has embedded participatory functions around surveying, sharing data and knowledge (safely) and collaborative spatial planning (drawing on maps).
Further development required?
Tool is functional for the region. Requires time/workshop(s) to train users and someone to manage and load additional data layers.
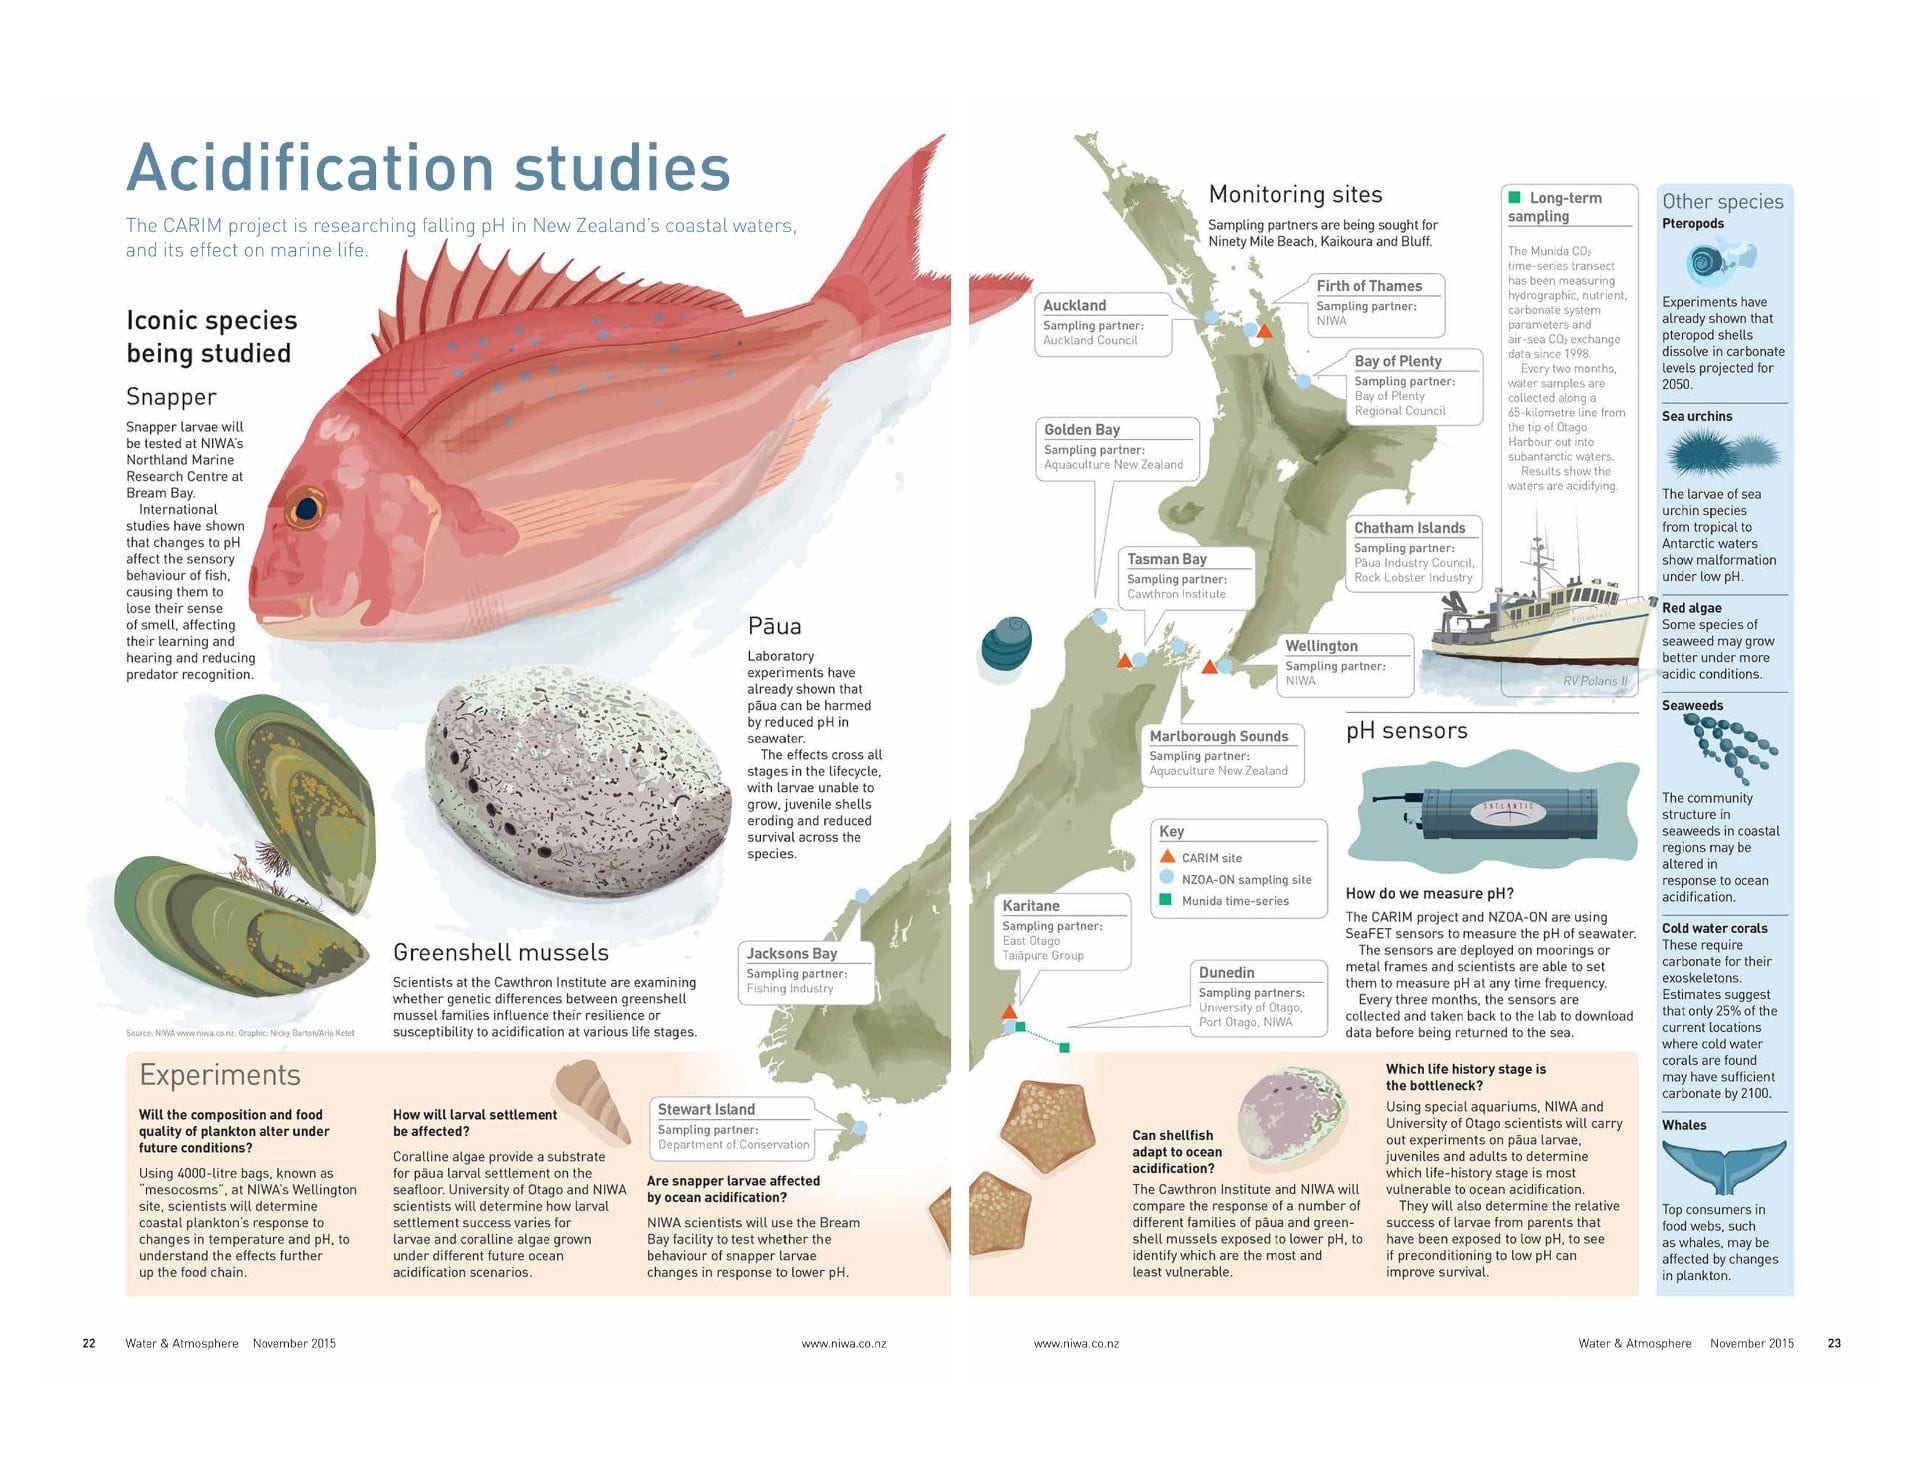
Appendix 15: Ocean acidification studies underway
Infographic highlighting the range of acidification studies underway. Infographic and further information available on the NIWA website
Appendix 16: Plan for a New Zealand ocean observing system
New Zealand Ocean Observing System (NZ-OOS)[28]
Year one plan
- A pan-New Zealand steering committee and governance board.
- Four working groups focused on estuaries to shelf, bluewater, data systems, and communications. The scope of each group will be expansive to overcome organization and science discipline silos.
- A catalogue of observational assets and existing marine data for New Zealand.
- A strategy for implementing mātauranga Māori in an NZ-OOS.
- Draft strategic plan built on a well-designed framework and collaborative governance structure.
- Business case for funding an NZ-OOS.
- Many of the elements, both observational and modelling, already exist in New Zealand.
Five year vision
- A widely subscribed data system built around the NZ-Ocean Data Network providing data to a wide range of users.
- A network of coastal monitoring assets in key regions across a range of organisations that follow standardised data exchange protocols.
- Access to model hindcast and reanalysis products for simulating and visualising New Zealand’s EEZ.
- The ability for rapid response for forecasting coastal hazards, oil spill trajectories, and biosecurity risk.
- Implementation of a network of sentinel sites for observing ecological outcome verifications along latitudinal and anthropogenic gradients.
- Develop and implement sentinel fish and marine megafauna data collection programs that indicate ecosystem change.
Ten year vision
- Widely accessible OOS visualisation system that enables society to engage with ocean data in new and exciting ways.
- Data assimilating operational models providing near real time forecasting of our entire EEZ.
- Commitment from the seafood industry, with the entire fishing fleet and aquaculture farms established as observing platforms.
- Integration of ecological layers and the inclusion of biogeochemical and molecular ocean data through aligned sampling programs.
- Successful integration of mātauranga Māori into a national OOS framework.
References and footnotes
[1] Te Ahukaramū Charles Royal (2007) Kaitiakitanga – guardianship and conservation, Te Ara – the Encyclopedia of New Zealand.
[2] Parliamentary Commissioner for the Environment (2020) Managing our estuaries. Wellington, New Zealand.
[3] Ministry for Primary Industries. Managing customary fisheries.
[4] Ministry for Primary Industries. About Māori customary fisheries.
[5] Sea change – Tai Timu Tai Pari. Acronyms and Māori terms.
[6] See Te Ohu Kaimoana.
[7] Environment Canterbury. Canterbury Regional Policy Statement, p 246.
[8] Heritage New Zealand Pouhere Taonga Act 2014, section 6.
[9] Fathom (2019) EAFM and the Fisheries Act 1996.
[10] Baird, S.J. and Mules, R. (2021, in review). Extent of bottom contact by commercial trawling and dredging in New Zealand waters, 1990-2019. New Zealand Aquatic Environment and Biodiversity Report, pending.
[11] Fisheries New Zealand (2019) National Fisheries Plan for Deepwater and Middle-Depth Fisheries 2019.
[12] Fisheries New Zealand (2019) National Fisheries Plan for Highly Migratory Species 2019. Fisheries New Zealand Technical Paper No: 2018/08.
[13] A longer vision is also given of: “Healthy Oceans: New Zealanders understand marine life and marine processes and, accordingly take responsibility for wisely managing the health of the ocean and its contribution to the present and future social, cultural, environmental and economic wellbeing of New Zealand.”
[14] Clubb, S. and Helson, J. (2006) Pragmatism and principles: The challenges of delivering a strategy to manage the environmental effects of fishing in the face of uncertainty, in proceedings of the 13th biennial conference of the International Institute of Fisheries Economics & Trade, Portsmouth, UK.
[15] Peart, R. et al. (2011) Governing our oceans: Environmental reform for the exclusive economic zone, p. 72.
[16] Cozens, P. (2014) Commentary: Some reflections on recent oceans policy and oceans governance issues in New Zealand, Australian Journal of Maritime & Ocean Affairs, 6(1), pp. 41–48.
[17] Tremlett, A. J. (2015) Working Paper 2015/01: Ocean Management in New Zealand: Findings from a structured discussion, pp. 1–20.
[18] McGuinness, W. and Hett, S. (2015) Proposal for the creation of an oceans institution, Think piece 22.
[19] Connon, R. E. et al. (2018) The utility of transcriptomics in fish conservation, Journal of Experimental Biology, 221(2).
[20] Anastasiadi, D. and Piferrer, F. (2019) Data from: A clockwork fish. Age-prediction using DNA methylation-based biomarkers in the European seabass, v5, Dataset, Molecular Ecology Resources, 20(2), 387-397.
[21] Thomsen, P. F. et al. (2016) Environmental DNA from seawater samples correlate with trawl catches of subarctic, deepwater fishes, PLoS One, 11(11), pp. 1–22.
[22] Jerde, C. L. (2019) Can we manage fisheries with the inherent uncertainty from eDNA?, Journal of Fish Biology, 1, pp. 1–13.
[23] Hansen, B. K. et al. (2018) The sceptical optimist: Challenges and perspectives for the application of environmental DNA in marine fisheries, Fish and Fisheries, 19(5), pp. 751–768.
[24] Zaiko, A. et al. (2018) Advantages and limitations of environmental DNA/RNA tools for marine biosecurity: Management and surveillance of non-indigenous species, Frontiers in Marine Science, 5.
[25] Ficetola, G. F. et al. (2008) Species detection using environmental DNA from water samples, Biology Letters, 4(4), pp. 423–425.
[26] Oosting, T. et al. (2019) Unlocking the potential of ancient fish DNA in the genomic era, Evolutionary Applications, (12) p. 1513–1522.
[27] Papa et al. (2020) Genetic stock structure of New Zealand fish and the use of genomics in fisheries management: An overview and outlook, New Zealand Journal of Zoology, pp. 1-31.
[28] O’Callaghan, J. et al. (2019) Developing an integrated ocean observing system for New Zealand, Frontiers in Marine Science, 6, pp. 1–7.